There's a bull case and a bear case for every stock. However, it's not always obvious what the arguments are on either side. In Bed Bath and Beyond's case, the bull thesis is readily apparent: a strong (debt free) balance sheet, high free cash flow generation, strong brand, ramping online sales, and low valuation. In this article, I'll detail the ugly, lesser-known bear argument, which could point to a stock in the low $60 range.
I'll first detail the argument from a high level using the income statement as a framework. I'll then show how that argument could lead to 20% downside for the stock.
(If you're interested in the underlying data or a Bed Bath & Beyond financial model, you can download it here)
Sales Slowing as Competition Heats Up
Bed Bath and Beyond's sales have noticeably slowed since 2010. In the eight quarters between 2009 and 2010, BBBY averaged comps of over 7%. Since that time, BBBY's comps have slowed to a 2.8% average over the following 15 quarters.

The slowdown in comps has come at a time when housing has been especially strong. As I've detailed in the past, home-related retailers tend to benefit when housing turnover is strong. Since 2010, existing home sales (shown below) has been notably strong, which has made BBBY's comp slowdown more disappointing.

Why is BBBY not benefiting from increased housing turnover? Strong results from other home-related retailers suggest that the industry growth is going to Bed Bath & Beyond's competitors.

Note that RH started reporting comparable brand revenue in 4Q13 (which includes their direct channel)
While these retailers might arguably be higher-end retailers than Bed Bath & Beyond, there is still likely a good amount of customer overlap. Some of the competitors and their initiatives are:
- Williams Sonoma (WSM): Williams Sonoma is seeing strong double digit comp growth at its West Elm brand, and the company is aggressively expanding its West Elm stores with 20% unit growth in 2014. Additionally, the company is generating high-single to low-double digit comp growth in its Pottery Barn brand as well.
- Restoration Hardware (RH): Restoration Hardware's results have been helped by its increasing products and real estate. On the product offering, RH is entering adjacent categories such as rugs and leather, which will increasingly bump against Bed Bath & Beyond offerings. The company is also closing smaller stores and replacing them with much larger stores that allow them to showcase more of their new products.
Aggressive expansion and strong demand for its products is a common factor driving outperformance at both of these companies. Additionally, it must be noted that both companies have had strong direct-to-consumer channels (with both online sales and catalog sales) - channels that Bed Bath & Beyond has only recently begun to invest in heavily (detailed later).
While not shown in the chart above, I suspect results from other competitors such as Amazon, Wayfair, Sur La Table, CB2, and other smaller online retailers have begun to take share as well. While the professional community appears to understand this aspect of the bear case, BBBY's share losses are not discussed frequently among casual investors and appear to be underappreciated.
Increasing competition is a key part of the bear thesis, as it has important implications for both sales and margins. As a result, it's worth asking why Bed Bath & Beyond might be losing share to competitors when they've been so successful up to this point in time. One possible explanation is that the product selection is less relevant to today's consumer. For example, consider this screenshot of comforter offerings from Bed Bath & Beyond and West Elm.

Bed Bath & Beyond's comforter offerings (left) are more traditional, and are displayed as such in a similarly designed room. Meanwhile, West Elm's comforter offerings (right) are more modern and sleek. One might argue that the products are simply a reflection of each retailer catering their products to their specific customers. However, bears might argue that the modern aesthetic is becoming increasingly relevant, especially as millenials age. Bed Bath & Beyond could be gradually losing share to retailers that have a product that is better suited to consumers' evolving tastes.
Competition and Online Investments Pressuring Margins
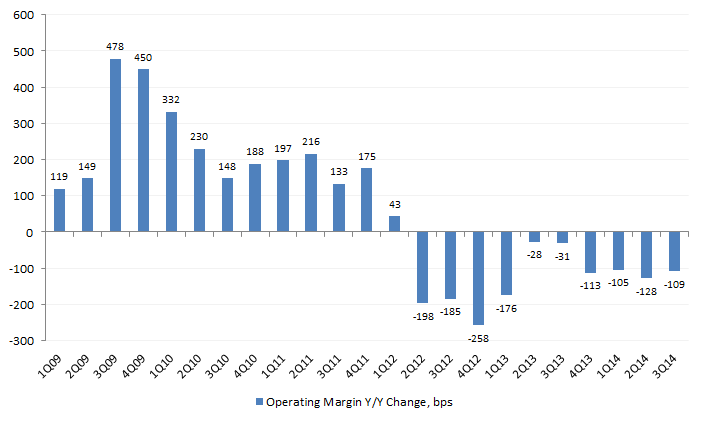
Like sales growth, Bed Bath and Beyond's margins have also gradually eroded over the last several years. It's important to first note that Bed Bath & Beyond has been one of the most efficient and profitable retailers in all of the 'hardline' (non-apparel, specialty) retail industry. In a world where 10% operating margins are cause for praise, Bed Bath & Beyond was able to achieve a peak operating margin of 16.5% in 2011. While extremely impressive, operating margins at these levels are also difficult to sustain. Since that time, margins have contracted for the last 10 consecutive quarters, and I believe margins will likely continue to contract at a faster level than investors anticipate. Margins have declined because of 1) competitive pressure, 2) online investments, and 3) acquisitions/concept expansion. Going forward, these three factors could continue to negatively impact margins.
1) Competitive pressure: A significant portion of the operating margin decline has been driven by competitive pressure. As shown below, gross margin (one of the two components of the operating margin) has declined for 12 consecutive quarters.

The table below highlights management's explanation for the gross margin decline. Increased coupon redemptions (those big coupons you get in the mail) and/or increased markdowns have been named as factors in every quarter. In other words, Bed Bath & Beyond is reducing prices, likely as a way of maintaining sales growth and driving traffic to stores.

Looking ahead, competitive pressures may force management to continue increasing promotional levels. Williams Sonoma and Restoration Hardware are still in their early stages in expanding their merchandise and real estate, and will continue to grow as a competitive threat to Bed Bath and Beyond. Additionally, online competitors are also multiplying each day. Sizable online companies such as Gilt and Groupon have also upped their home furnishings offerings and may be nipping at Bed Bath and Beyond's customer base. As consumers start to shop elsewhere, Bed Bath & Beyond may have to reduce prices further to entice customers to their stores, which could pressure gross margin further.
2) Online investments: While Bed Bath & Beyond's online sales have grown significantly in recent quarters, that growth has come at the cost of lower profitability. In the past, the company's website was buggy and difficult to navigate. Management recently invested heavily in their e-commerce by upgrading the site, creating new mobile apps, and installing a new data center. These investments were expensive and led to SG&A deleverage (and therefore a decline in profitability), shown below. Furthermore, increased shipping expenses have also recently begun to hurt their profitability (shown in blue in the gross margin chart above) as their online sales have begun to grow.

Note that, unlike gross margin, increases in SG&A expense as a percentage of sales represents a decline in profitability.
Going forward, elevated IT investment spend is likely to continue. Competitors like Amazon continue to add new features like free content (music and videos), shorter shipping times, more photos and reviews, and early access to new devices (like the Amazon Echo). While Bed Bath & Beyond has already made significant upgrades to their website, they will likely have to continue to invest heavily just to keep up with their tech-focused competitors. The company may also have to increase IT security measures, as several other retailers have had high-profile data leaks in 2014. Furthermore, as online sales become a bigger portion of their overall revenue, they will have to spend more money shipping those items to customers.
3) Acquisitions/concept expansion: Bed Bath & Beyond's expansion of its other retail concepts will also likely be dilutive to margins. The company owns 1,019 of its own Bed Bath & Beyond stores, along with 270 Cost Plus stores, 93 buybuyBABY stores, 78 Christmas Tree Shop stores, and 50 Harmon stores. Management has gradually grown the Cost Plus and buybuyBABY stores over the last several years. These concepts are not as efficient as a Bed Bath & Beyond store (few retail stores are), and therefore put pressure on operating margins as they grow to become a larger part of the consolidated company's revenue (see chart below). Additionally, should Bed Bath & Beyond acquire another retail store (like they did with Cost Plus in 2012), this would also likely prove to be margin dilutive.
In the coming years, I expect management to continue to grow its concepts as the core Bed Bath & Beyond stores reach saturation. The growth of lower-margin concepts will likely put pressure on operating margins.

Quantifying the Bear Thesis
Now that we've covered the bear thesis for declining sales and profitability, we can now quantify how bears might see the future for Bed Bath & Beyond compared to consensus expectations. We'll do this by modeling our own earnings estimate, and then comparing that to the average estimate on Wall Street, which is a good measure of consensus expectations. (Again, for those who are interested in the financial model, access them on the models page.)
To build our own earnings estimate, we first have to set some assumptions for sales and profitability. For sales, we'll assume 2015 comp growth of 2.0% (compared to average Wall Street estimates of 2.4%), with lower growth due to the increased competition detailed earlier in the article. For profitability, we'll assume an operating margin decline to 12.0% (compared to the Wall St. average of 12.6%) driven by increased investments and markdowns.
Note that the profitability difference between consensus estimates and bear estimates is significant. Bear estimates forecast a steep decline in line with recent performance over the last several years. Meanwhile, consensus estimates forecast a decline in profitability, but at a much more moderate decline that suggests the bottom is near.

Using the bear case assumptions just highlighted, (and several other forecasts that I won't detail here), Bed Bath & Beyond is expected to generate EPS of $5.29 and EBITDA of $1,728, both of which are below consensus estimates.


Note that growth rates are calculated off of consensus 2014 estimates.
Valuation: What this Means for the Stock
Now, we have to consider what the appropriate multiple would be to apply to our new EPS estimate that we just calculated above. If the bear case plays out and at the end of next year we're looking at a Bed Bath and Beyond with 3% sales growth and an operating margin that's declining 90 basis points, what multiple would it earn? Let's just focus on the P/E valuation methodology. Bears would certainly argue that the stock doesn't deserve the current 14.5x multiple. But how much lower should we go? An argument could be made that retailers that are losing share and losing profitability should trade at a significant discount given the risk involved. Consider the case of Best Buy in 2012, when it was losing share to Apple and Amazon and had shrinking margins. Back then, Best Buy traded at a 7x multiple. However, this situation doesn't seem quite as dire. After all, Bed Bath & Beyond is still a highly profitable business with positive comp growth and significant free cash flow generation. Additionally, the industry is not quite as troubled, as home furnishings continues to grow and remains highly fragmented. Using a 12x multiple (2.5 points below its current trading multiple, and the lowest multiple it has traded over the last five years) off of the bearish outputs, Bed Bath & Beyond stock would be worth $63, 19% below its current trading value. Given the numerous assumptions that were used to arrive at this price, this does not mean this is a precise measurement of the stock's value. However, it gives us a general range of where the stock might go over the next year, and a justification for it as well.

Measuring Risk/Reward
What good does a target price do for investors? For one, it allows bears to get a general sense of what their upside is (akin to the pot size for poker players). Two, it allows bulls to understand what their downside risk is. Investors often make bets without fully understanding how much they stand to potentially lose. With a general sense of the upside/downside risk, investors can gauge whether the risk/reward is worth an investment.
The Bull Counterpoint
The point of this post was to shed light on the under-reported bear thesis behind Bed Bath & Beyond. However, there's an equally compelling bull thesis for the stock, and it usually counters with:
- Online sales: After years of running an old website, Bed Bath & Beyond has finally updated its website and IT. The result could be significant pent up demand for online sales, which could drive overall sales higher.
- Recent sales growth: While comps have slowed recently, Bed Bath & Beyond recently gave strong guidance of 4-5% comps for 4Q14. The company may be seeing sales return to higher growth rates.
- Specialty store expansion: In addition to regular new store openings, the company is also opening specialty departments within their existing stores. Management recently noted that nearly 200 stores currently have specialty departments (health and beauty, baby, food). They've stated that another 240 stores have an opportunity to open one of these departments. Additionally, 1/3 of the existing 200 stores with a specialty department could open an additional department.
- Profitability bottoming out: With all of these sales initiatives, margins will eventually bottom out near current levels as their e-commerce initiative hits scale and becomes more profitable.
- Free cash flow generation: Bed Bath and Beyond generates over $900 million in free cash flow, which could be returned to shareholders in the form of buybacks or dividends. These actions could limit the downside risk.
Recap
- Bed Bath & Beyond sales growth has decelerated significantly over the last several years, despite a strong housing background. Profitability has likewise declined driven by increased couponing and investments in technology
- Bears believe increased competition has led to the decline in sales growth and profitability, and that this will continue to be a headwind in 2015
- With lower earnings and a lower multiple, bears might argue for a stock in the low $60s
4Q Earnings the Next Datapoint
With another two weeks left to go in 4Q, it will be several months until we get the next data point on which direction the company is heading. The next 4Q earnings release is expected on April 8th; look for comp performance and operating margins to shed light on how the company is performing.